Observability and Monitoring Implementation for Fintech Client
A Merchant Cash Advance That’s Perfect For Gig Workers

Segment
Financial Service
Location
Miami, USA
Timeline
February 2025 - April 2025
Team
DevOps engineer Project manager

Fundo LLC was created to fill this gap in the marketplace, providing gig workers with an easy alternative to traditional bank and personal loans. Most merchant cash advance providers will not even consider assisting a self-employed person that generates less than $10,000 in monthly revenue.
Applying For a Fundo LLC Merchant Cash Advance is Simple:
The Need and Challenges
The primary challenge was the time-consuming process of detecting and resolving application and infrastructure issues, which led to bad user experience and financial losses.
The client stored logs in txt. format within Azure Blob Storage. Multiple data sources generated logs, metrics, and there was no unified platform for visibility.
This made it challenging to identify bugs and slowed down problem resolution with the cloud infrastructure. To diagnose an issue, it was necessary to download a massive file containing information that was hard to filter. Engineers spent hours to troubleshoot logs from different sources to correlate existing events to identify root cause.
It was necessary to monitor the infrastructure and application health in a proactive, centralized manner with the possibility of parallel access for all team members.
Why 2ops?

What I found most impressive about 2ops is their professionalism throughout the process
What was implemented?
Application Front-End and Back-End Logs Monitoring
Integrated Grafana Loki SDK for collecting logs from backend services.
Implemented Grafana Faro SDK for capturing front-end logs and errors.
Created real-time alert policies to notify the team of critical failures. Filtered Grafana alerts for quick response, distributed according to the following types:
1. Critical: A critical situation requiring immediate attention
2. High: Resource utilization exceeds 90%.
3. Warning: Resource utilization exceeds 85%.
Centralized Cloud Resources Monitoring and Visualization
- Integrated Azure Monitor and Cloudflare logs to centralize data from infrastructure resources.
- Simple visualization of monitoring data across different clouds
Grafana Cloud Stack Configuration & Setup
- Deployed Grafana, Prometheus, and Loki on the company’s Azure cloud environment.
- Configured user access, permissions, and security policies.
Release Deployment Event Tracking
- Implemented GitHub Action steps to log deployment events in Grafana, allowing engineers to correlate deployments with performance changes..
Synthetic Monitoring & Dashboards
- Set up synthetic monitoring for key endpoints to proactively detect issues.
- Created multiple dashboards for Azure, Cloudflare, and an all-in-one application dashboard with critical system metrics.
Knowledge Sharing & Training
Delivered execution reports and a final team demo to ensure engineers could use and manage Grafana effectively.
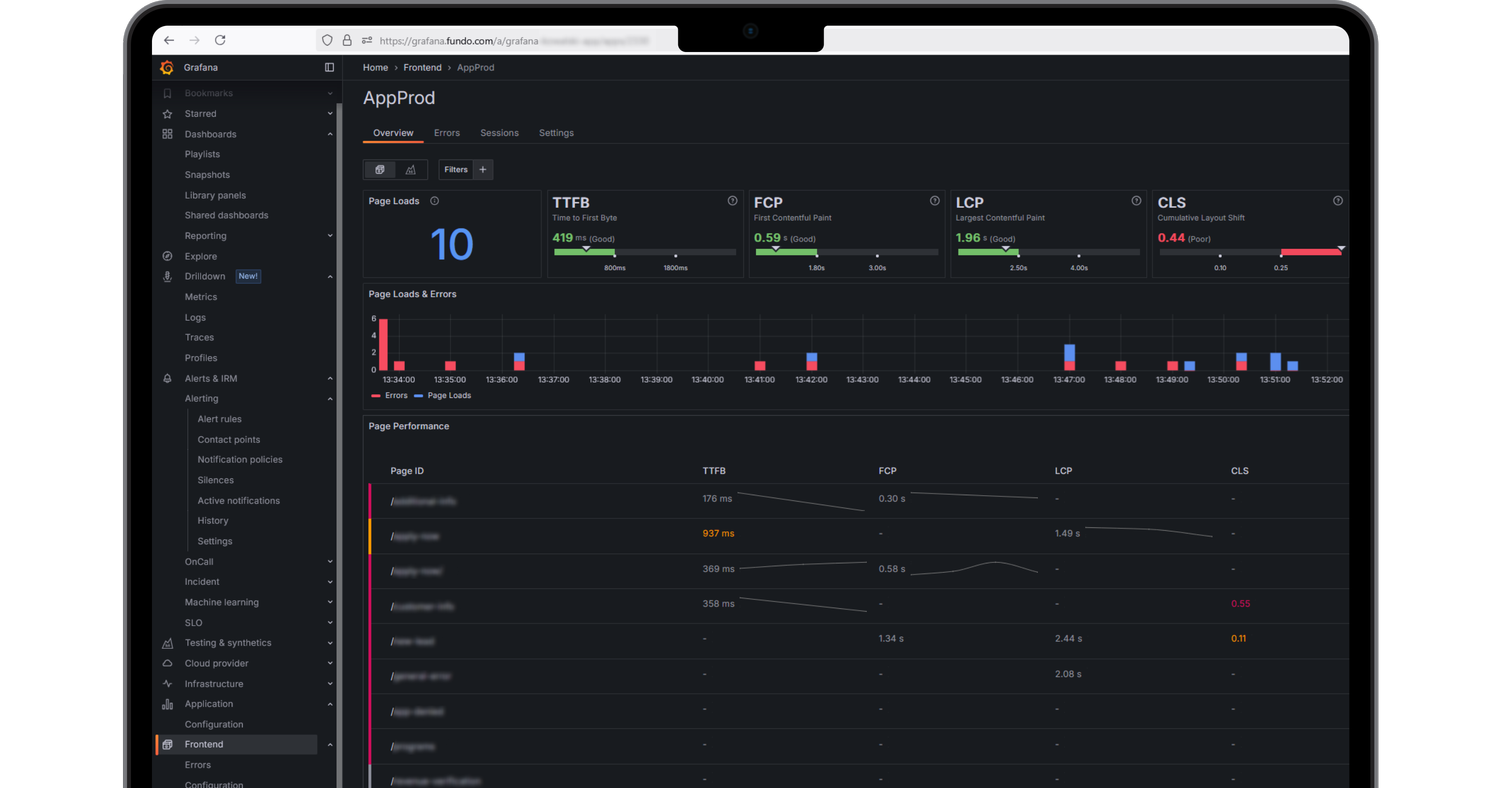
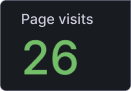
Visualization of monitoring data

Services and Technologies
Technical Team

Project Manager
DevOps Engineer
Observability & Monitoring

Grafana
Prometheus

Loki
Faro
Cloud Infrastructure
Microsoft Azure

Azure Monitor
Network & Security

Cloudflare integration
CI/CD & Automation

GitHub Actions for deployment tracking
Alerting & Notifications

Configured real-time alerting policies
It’s about traditional bank alternative
Benefits for Client
The Entire Team Access to Grafana
With real-time visibility into system performance, engineers, product managers, and executives can proactively identify and resolve issues, reducing downtime and improving customer experience. This cross-functional transparency enhances collaboration between technical and business teams.
Custom Monitoring & Noise-Free Alerts
Tailored dashboards & meaningful alerts that focus on what matters—no more alert fatigue from 10,000+ notifications per day.
Centralized Logs and Metrics monitoring
Simple visualization of monitoring data across different clouds provides real-time insights into system performance, ensuring faster issue detection and resolution. With unified dashboards, we gain complete visibility across applications, infrastructure, and security logs.
Proactive Monitoring
Predictive analytics helps to reduce IT costs and increase infrastructure and application efficiency. It delivers immense business value by ensuring system reliability, performance, and security in real time.
Improved User Experience
Proactive alerting and synthetic monitoring helps identify and resolve issues before they impact customers. This leads to faster transactions, fewer service disruptions, and greater trust
Data-Driven Decisions
Full control and transparency over all operations allows executives and IT teams to identify bottlenecks before they escalate, optimizing resource allocation and predicting failures